
What Is Splunk Observability Cloud | A Full Guide 2026
Key takeaways
- Splunk Observability Cloud gives real-time visibility into applications, infrastructure, cloud services, and user experiences by combining metrics, logs, traces, and events.
- It helps teams find and fix issues faster by correlating data from across the entire technology stack and identifying the root cause of problems.
- The platform supports most types of environments, including cloud, hybrid, Kubernetes, containers, and microservices architectures.
- Splunk integrates with major cloud providers and existing tools, making it easier to build a unified observability strategy without replacing current systems.
- There is plenty of AI features you can use to make the troubleshooting and analysis of AI-powered applications easier.
Modern businesses depend on digital services more than ever before. Whether it is an e-commerce platform processing transactions, a manufacturing company creating goods, or a financial institution processing our money, the expectation is always the same: systems must be available, responsive, and reliable.
The challenge is that new IT environments have become incredibly complex. Applications are no longer hosted on a single server in a data center. Instead, they often run across multiple cloud platforms, containers, microservices, databases, APIs, and third-party services. A single customer transaction may travel through dozens of systems before it is completed.
When something goes wrong, finding the root cause can feel like searching for a needle in a haystack. But with observability, the needle suddenly becomes more visible.
Among the leading observability solutions available today, Splunk Observability has been recognized as a powerful platform for monitoring infrastructure, applications, cloud environments, and business services in real time. It helps organizations move beyond traditional monitoring and gain a deeper understanding of how their systems behave.
In this guide, we will explore what Splunk Observability is, how it works, its key features, integration options, troubleshooting capabilities, and the business benefits it delivers.
How does Splunk work? Understanding the Foundation of Observability
Before diving into Splunk Observability, it is worth understanding the broader Splunk ecosystem.
Every second, organizations generate massive amounts of machine data. This data comes from servers, applications, firewalls, cloud services, IoT devices, operating systems, databases, and countless other sources.
The problem is not the lack of data, but its processing and understanding.
Raw logs are often unstructured. Different systems generate information in different formats, use different terminology, and record events with varying levels of detail. Without a common framework, investigating incidents becomes slow and difficult.
But not with Splunk.
The platform collects data from any source, processes it, structures it, and makes it searchable. Instead of going through thousands or millions of log entries by hand, teams can now search, analyze, and visualize information to identify patterns, detect anomalies, and investigate incidents.
Over the years, Splunk expanded beyond log management and security analytics into a broader observability platform that combines multiple telemetry sources into a single view of system health. This evolution gave rise to the Splunk Observability Cloud.
What Is Splunk Observability Cloud?
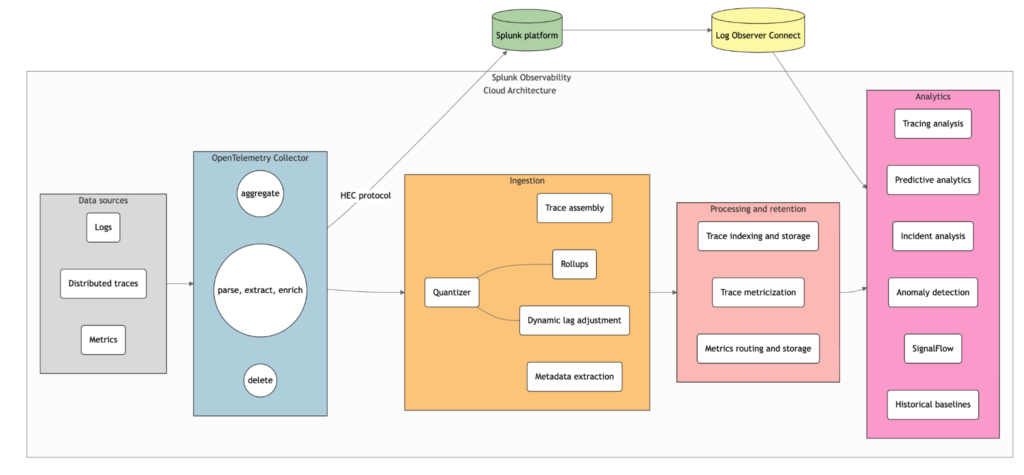
Splunk Observability Cloud is a Software-as-a-Service (SaaS) platform designed to provide real-time visibility into applications, infrastructure, and digital services.
This platform is OpenTelemetry-native, and it was designed and built from the ground up to use OpenTelemetry as its primary, default way of handling observability data (traces, metrics, and logs).
Together, these data sources provide a complete picture of how systems perform and interact.
For example, a traditional monitoring solution may tell you that a server is experiencing high CPU usage. An observability platform goes further. It helps you understand why CPU usage increased, which application caused the problem, how customers were affected, and what changes occurred before the issue appeared.
This deeper level of visibility enables organizations to move from reactive firefighting to proactive system management.
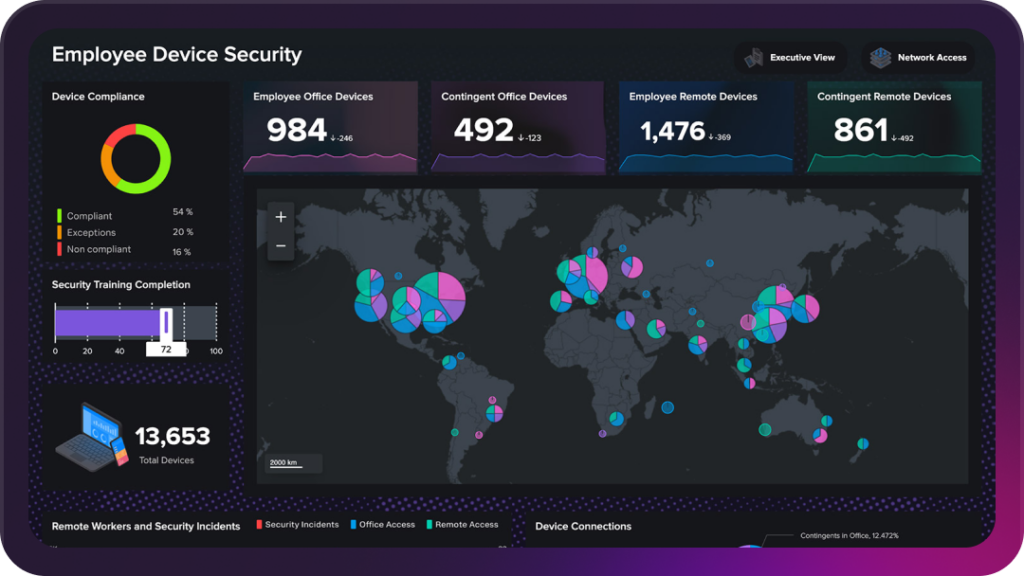
Observability vs Monitoring - why traditional monitoring is no longer enough
Traditional monitoring tools were designed for relatively simple environments.
A server generated an alert when CPU utilization exceeded a threshold. An administrator received a notification and investigated the problem.
Modern environments are very different. Applications are distributed across multiple services, containers are created and destroyed dynamically and cloud resources scale automatically.
In these environments, monitoring isolated components is no longer sufficient. Organizations need to understand relationships between systems, dependencies between services, and the complete path of a customer transaction.
Observability addresses this challenge by providing context rather than isolated alerts.
Instead of asking: ”What failed?”
Teams can ask: ”Why did it fail?”
That difference dramatically reduces troubleshooting time and improves operational resilience.
The Three Pillars of Observability
At the heart of Splunk Observability are three key telemetry sources – metrics, logs and traces, called “The Three Pillars of Observability”. Used together, they bring required information to troubleshoot arising issues in your system.
Metrics
Metrics are aggregated measurements over time. They provide a high-level view of system health and performance. They answer the question, ”Is something wrong?” because the change in the average data is visible. Unlike log data, metrics can be stored and optimized more efficiently for querying. While they lack the detailed information found in logs, they provide specific measurements of a system over time.
Examples include:
- CPU utilization
- Memory consumption
- Network throughput
- Disk I/O
- Temperature readings
Logs
Logs are detailed records of system activity. Log usually contains timestamp, severity, message in human readable form and attributes.
They capture events such as:
- User logins
- Application errors
- Configuration changes
- Security events
- Database transactions
Traces
Metrics tell you what happened, but they don’t tell you why. As the name suggests, traces trace the path of a single request through the system. Traces pull together data from metrics and logs to provide a more complete picture of a system’s performance over time.
A single trace typically captures data about:
- Spans (service name, operation name, duration and other metadata)
- Errors
- Duration of important operations within each service
- Custom attributes
Metrics, logs and traces are powerful, but by themselves are not the answer to all problems. If you want to know how to introduce observability in your company, read our e-book.
Observability Playbook
WeAre’s Observability Playbook is a practical guide for IT, DevOps, platform, and business teams that want to understand how observability helps improve visibility, reduce downtime, and connect technical performance to business outcomes. It explains how logs, metrics, and traces work together, why observability matters in modern distributed environments, how mature observability practices companies have, and how organisations can move step by step from reactive troubleshooting toward faster incident response, shared visibility, and stronger operational trust.
Key Features of Splunk Observability Cloud
One of the reasons organizations adopt Splunk Observability is its broad set of capabilities.
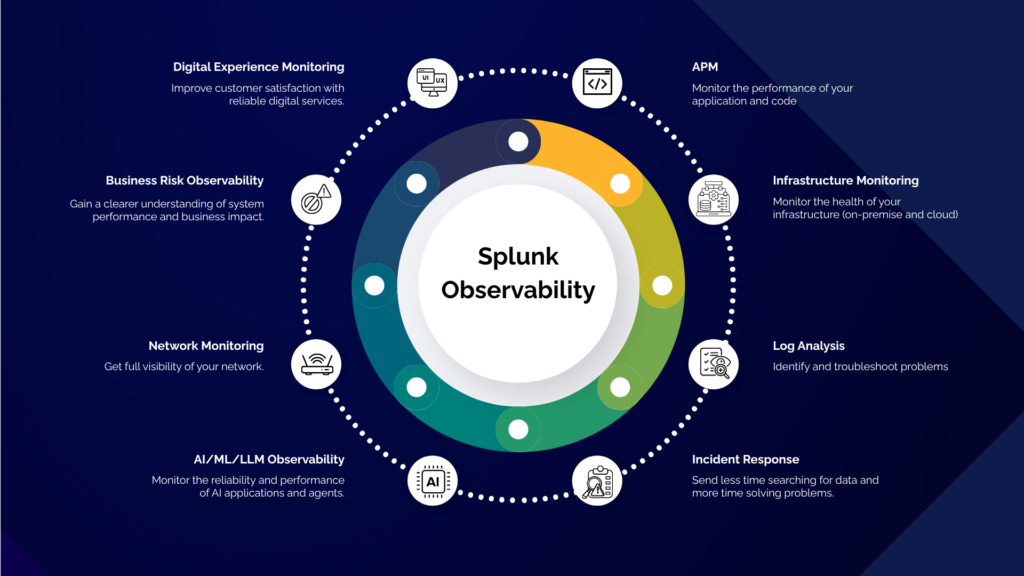
Infrastructure Monitoring
Perform powerful, capable analytics on your on-premises, hybrid and multi-cloud monitoring, including Kubernetes, databases and serverless.
What can I do with Splunk Infrastructure Monitoring?
- Navigate and explore every layer of your technology environment, from cloud services and containers to physical and virtual hosts.
- Access, review, and manage the metrics collected across your infrastructure, applications, and other connected data sources.
- Perform calculations and analyze data to uncover trends, patterns, and performance insights.
- Create visual representations of metrics to gain a clearer understanding of system behavior and health.
- Stay informed with alerts and notifications that highlight important changes across services, applications, and infrastructure.
Application Performance Monitoring (APM)
Application Performance Monitoring (APM) helps teams understand how applications perform in production. Identify sources of latency, errors & anomalies with directed troubleshooting and dynamic telemetry maps.
What can I do with Application Infrastructure Monitoring?
- Visualize all your services and understand how they interact with one another through a service map that highlights dependencies across your environment.
- Track the performance of individual service endpoints with Endpoint Performance. Built-in filtering, sorting, and comparison tools make it easier to identify endpoints experiencing spikes in traffic, increased error rates, or slower response times.
- Analyze how database queries affect service performance and availability. Quickly identify resource-intensive, poorly optimized, or long-running queries that may be contributing to system issues.
- Gain deeper insight into application behavior with AlwaysOn Profiling, a capability within Splunk APM. By continuously collecting CPU and memory usage data from running applications, it helps connect infrastructure performance with application traces and transactions.
- Stay ahead of potential issues by using detectors that monitor key service metrics such as request volume, latency, and error rates. Preconfigured detectors are available out of the box, while custom alerting rules can be tailored to the metrics that matter most to your organization.
- Index span tags to explore application performance from different perspectives. This allows you to segment and analyze data based on attributes that are relevant to your specific environment and use cases.
- Use Tag Spotlight to examine service latency, request rates, and error rates across indexed span tags. Performance can be viewed by endpoint, environment, operation type, and other dimensions, with additional filtering options for more detailed analysis.
- Search and investigate complete trace data to troubleshoot issues more effectively. Aggregate and analyze traces across tags and attributes to uncover performance bottlenecks, identify recurring patterns, and understand how different user groups are affected.
- Follow end-to-end transactions across distributed systems to gain visibility into critical business processes and monitor the services that support them.
- Access ready-made dashboards that provide an immediate overview of service health, endpoint performance, and the overall state of your systems.
Real User Monitoring (RUM)
With Splunk Real User Monitoring (RUM), you can gain insight about the performance and health of the front-end user experience of your application. Measure impact of every resource, image, route change & API call. Splunk RUM offers two solutions: for browser and for mobile.
What can I do with Splunk RUM?
- Detect application errors and performance issues within browser sessions, including slow-loading resources and other factors that can negatively affect the user experience.
- Define and track custom events to collect valuable insights into user interactions, customer journeys, and behavior across your website or application.
- Explore and test the capabilities of Splunk RUM for Mobile using sample applications designed to demonstrate real-world monitoring and troubleshooting scenarios.
Splunk Log Observer Connect
No-code, in-context log-based troubleshooting. Splunk Log Observer Connect is an integration that allows you to query your Splunk Enterprise or Splunk Cloud Platform logs using the capabilities of Splunk Log Observer and Related Content in Splunk Observability Cloud. With this tool you can perform codeless queries on logs to detect the source of problems in your systems. Analyze logs alongside real-time metrics and traces for more context of your events.
Splunk Observability for AI
- Monitor the reliability and performance of AI applications and agents.
- Track resource consumption and operational costs, including AI model usage.
- Identify issues that affect the quality and consistency of AI outputs.
- Gain visibility into AI workloads using the same observability principles applied to traditional applications.
Besides Infrastructure Monitoring, APM, RUM, and Log Observer, Splunk Observability Cloud also includes:
- Synthetic Monitoring – Proactively tests websites, APIs, and critical user journeys to identify issues before they impact users.
- Database Query Performance Monitoring (DB Query Performance) – Provides visibility into database performance, helping identify slow queries and database bottlenecks.
- Splunk On-Call – Supports incident response with alert routing, escalation policies, on-call schedules, and integrations with collaboration tools.
- Service Level Objectives (SLOs) – Enables teams to define and track service reliability goals using SLIs and error budgets.
- SignalFlow Analytics – A real-time analytics engine that powers advanced alerting, custom detectors, and streaming data analysis.
- Alerts and Detectors – Provides intelligent alerting capabilities, including static thresholds, anomaly detection, and automated detectors.
- Custom Dashboards and Visualization – Allows teams to create dashboards combining metrics, traces, logs, and service health information.
- OpenTelemetry Support – Uses the Splunk Distribution of OpenTelemetry to collect and correlate metrics, traces, and logs across environments.
- Metrics Pipeline Management – Helps optimize telemetry data by filtering, routing, and reducing unnecessary metric ingestion.
- AI Assistant – Offers AI-powered guidance to support troubleshooting and accelerate investigations.
What Metrics Does Splunk Infrastructure Observability Track?
One of the most common questions organizations ask is what exactly they can monitor.
The answer is almost everything.
Infrastructure observability typically includes:
System Metrics
- CPU utilization
- Memory consumption
- Process activity
- System load
- Resource allocation
Network Metrics
- Bandwidth usage
- Network latency
- Packet loss
- Connection statistics
- Throughput measurements
Storage Metrics
- Disk capacity
- Read/write operations
- Storage latency
- Input/output performance
Cloud Metrics
- Virtual machine performance
- Container resource utilization
- Cloud service consumption
- Autoscaling activity
Application Metrics
- Response times
- Request volumes
- Error rates
- Transaction throughput
- Dependency performance
Business Metrics
Many organizations also track business-oriented KPIs, such as:
- Order completion rates
- Revenue-impacting events
- Customer experience indicators
- Service-level objectives
This combination of technical and business metrics helps organizations understand not only system health but also business impact.
Cloud adoption has fundamentally changed how organizations manage infrastructure.
Many businesses now operate across:
- On-premises environments
- Private clouds
- Public clouds
- Multi-cloud architectures
Managing visibility across these environments can be challenging.
Splunk Observability addresses this challenge by providing a unified view across the entire technology stack.
Splunk Observability Integration Options
A monitoring platform is only as good as its ability to connect with existing systems. Fortunately, Splunk Observability offers extensive integration capabilities.
Cloud Integrations
Native integrations support major cloud providers, including:
- Amazon Web Services (AWS)
- Microsoft Azure
- Google Cloud Platform (GCP)
These integrations enable automatic collection of cloud telemetry and service metrics.
Container Integrations
Organizations running containerized workloads can integrate with:
- Kubernetes
- Docker
- Container orchestration platforms
This provides visibility into highly dynamic environments.
API-Based Integrations
APIs allow organizations to connect custom applications and internal systems.
This flexibility is particularly useful when monitoring unique business processes.
Third-Party Tool Integrations
Many organizations already have monitoring investments in place.
Splunk Observability can integrate with various third-party solutions, reducing disruption and preserving existing investments.
Instead of replacing everything overnight, organizations can gradually build a unified observability strategy.
Troubleshooting with Splunk Observability?
One of the most valuable aspects of observability is faster problem resolution.
Traditional troubleshooting often involves jumping between multiple tools, collecting data manually, and making educated guesses. Splunk Observability makes it much easier.
Step 1: Detect the Problem
Monitoring and alerting systems identify abnormal behavior.
Examples include:
- Increased response times
- Rising error rates
- Resource exhaustion
- Service degradation
Step 2: Investigate the Impact
Teams can determine:
- Which services are affected
- Which users are impacted
- Whether the issue is isolated or widespread
Step 3: Analyze Dependencies
Distributed tracing reveals how services interact.
This makes it easier to identify the true source of a problem rather than chasing symptoms.
Step 4: Identify Root Cause
By correlating metrics, logs, and traces, teams gain a complete picture of the incident.
Instead of asking multiple teams to investigate independently, everyone works from the same source of truth.
Step 5: Resolve and Learn
Once the issue is resolved, teams can use historical data to understand what happened and prevent similar incidents in the future.
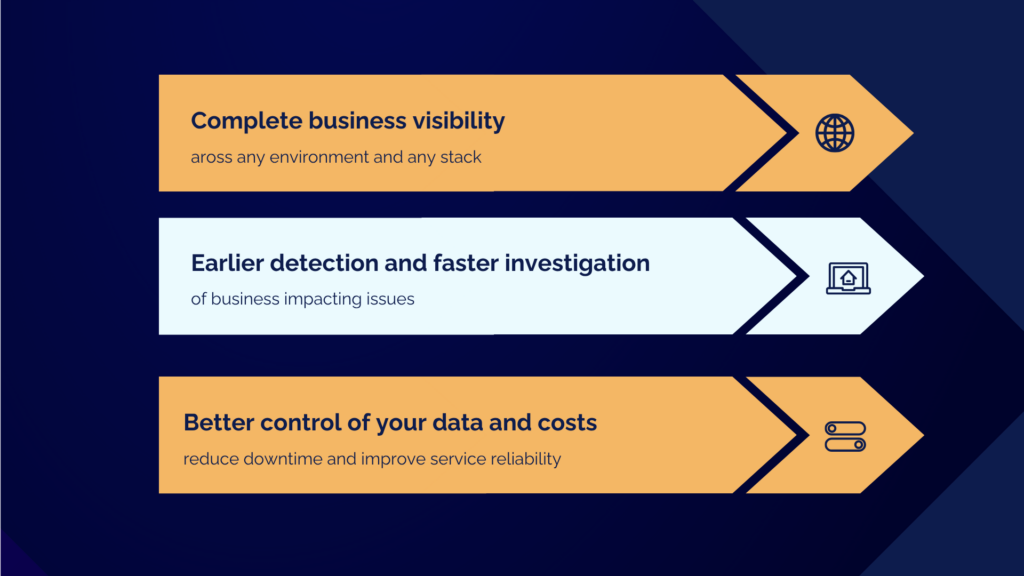
Business Benefits of Splunk Observability
- Answer critical business questions like:
- What is the cost of a downtime?
- What is the real cost of producing a single product – like one roll, screw or t-shirt?
- Why is the number of successful payments less frequent than usual?
- How to make the delivery in the shortest time possible?
- Is it the attempted fraud in a banking transaction?
- Collect high-quality telemetry that is automatically linked across services, allowing engineers to find the root cause in minutes, not hours.
- Give teams a common starting point. Instead of gathering people to guess where the problem might be, they can start with evidence.
- Deliver better experience to customers and make your services reliable
- Reduce downtime and number of incidents
- Infrastructure optimization (reducing wasted resources)
Observability explains how systems interact, where risk accumulates, and how overall technical factors affect user and business outcomes.
AI features in Splunk Observability Cloud
AI Assistant
Splunk Observability Cloud includes an AI Assistant that helps teams troubleshoot issues using natural language. Instead of manually searching through multiple dashboards and datasets, users can ask questions and find relevant insights quicker.
Key features:
- Interact with observability data using natural language to find information faster.
- Accelerate investigations by bringing together insights from metrics, traces, and logs.
- Get guided support during troubleshooting and root cause analysis.
- Understand system context more easily, including service dependencies and relationships.
- Simplify day-to-day monitoring tasks by reducing the need for complex queries and manual navigation.
Built-in Analytics and Automation
Splunk also uses AI to reduce repetitive operational work and help teams focus on resolving issues rather than collecting information.
These capabilities include:
- Prebuilt analytics that highlight unusual behaviour and important trends within observability data.
- Task automation that simplifies common monitoring and investigation activities.
- Context-aware recommendations that support teams during incident response.
- Integration with the broader Splunk platform, allowing organizations to use AI capabilities across their observability and security workflows.
WeAre Solutions Awarded Splunk Partner of the Year FY2026 by Cisco Finland
We are proud to share that WeAre has recently awarded WeAre Solutions Oy as the Splunk Partner of the Year for FY2026. Read more here.
Real-World Example: Fraud Detection with Splunk
See Splunk in action
Read the full case study to see how we utilized Splunk to deliver measurable impact.
Read the case studyConclusion
Modern digital services are too complex to manage with traditional monitoring alone. Organizations need to understand how apps, infrastructure, and business services work together.
Splunk Observability Cloud gives you that visibility by combining metrics, logs, traces, and real-time analytics into one platform. Teams can keep an eye on infrastructure, see how well applications are performing, fix problems faster, and understand how technical issues affect the business.
If you’d like to get started with observability, we encourage you to take our free assessment. Once you’ve filled out the form, we’ll send you expert recommendations for your infrastructure.
About WeAre Solutions Oy
WeAre Solutions Oy is a Finnish observability-focused consultancy and a leading Splunk Elite Partner in the Nordics. We specialize in observability and monitoring (using Splunk), Atlassian services (Jira), and software development. Founded in 2016 and headquartered in Helsinki, our mission is to turn observability into a competitive advantage for organizations. We work with organizations that need more than just tooling. They need a partner who understands how to connect technical visibility with business value.
Our experience includes supporting regulated and business-critical environments, where reliability, clarity, and long-term maintainability matter. We combine consulting, implementation, optimization, and managed services into one seamless model, helping our customers move from fragmented visibility to stronger operational control with confidence.
At WeAre, we help organizations assess their Splunk environments, identify improvement opportunities, and align performance with real business needs. You can start with an observability assessment to understand your current state, or contact our team for a free consultation.
Free Observability
Assessment and Consultation
30-minute expert consultation
Custom improvement roadmap
Detailed assessment report
Facebook
Twitter
LinkedIn