
AI Monitoring with Splunk: How to Track Costs, Token Usage, Quality and Agent Reliability
Key takeaways
- AI monitoring follows the full path from a user request to a model response, tool call, agent decision, infrastructure dependency, and business outcome.
- Token counts help explain model consumption, but a token-based estimate is not the same as the amount on a provider invoice.
- A technically successful AI run may still produce a poor answer, choose the wrong action, or fail to complete the intended task.
- AI agent monitoring needs traces or structured run records that show each step, retry, tool call, handoff, timeout, and human escalation.
- Output evaluation should combine clear acceptance criteria, representative test data, automated checks where supported, and human review for important decisions.
- Splunk supports a gradual path, from custom logs in Splunk Cloud to dedicated token, cost, infrastructure, and Agent Observability capabilities.
- The best first step is one workload, one business question, and a small set of measures that people will actually use.
AI Monitoring with Splunk: How to Track Costs, Token Usage, Quality and Agent Reliability
Companies are building AI faster than ever. Splunk’s 2026 research shows that 56% of organisations have deployed or are rolling out their own AI agents, and 92% saw machine data grow in the last year, with AI agents and AI-assisted software development as the top drivers. More AI in production means more ways for it to go wrong quietly.
To put it simply, an AI application can be online and still fail in ways that ordinary monitoring does not show. It may answer slowly, use far more tokens than expected, choose the wrong tool, repeat the same steps, return an unsupported answer, or complete the technical workflow without delivering a useful business result.
This is why AI monitoring needs a wider view than uptime, CPU, and error rates. Teams need to understand how the application behaves, what the model and agent are doing, how much each run consumes, whether the output is useful, and which part of the stack caused a problem.
For organisations already using Splunk, much of this work can begin with familiar data: logs, metrics, traces, dashboards, alerts and run records. Newer Splunk capabilities extend that foundation into AI token and cost monitoring, agent observability, output evaluation, and AI infrastructure monitoring.
This guide explains what AI monitoring means in practice, what to measure, how Splunk fits, and how to start with one manageable workload.
What AI monitoring means
AI monitoring is the practice of collecting and analysing evidence about how an AI application behaves in development and production. That evidence can include application logs, model calls, token usage, latency, errors, tool calls, retrieval steps, agent decisions, output evaluations, infrastructure signals, and business outcomes.
The purpose is simple. When something becomes slow, unreliable, expensive, or inaccurate, the team should be able to see what happened and where to investigate.
AI monitoring does not mean using artificial intelligence to monitor ordinary IT systems. That is a different use case, often described as AIOps or AI-assisted operations. This guide focuses on monitoring AI workloads themselves, including large language model applications, retrieval-augmented generation systems, coding assistants, and AI agents.
Why ordinary application monitoring is not enough
Traditional application performance monitoring remains essential. An AI application still depends on APIs, databases, containers, networks, queues, and cloud services. Teams still need to watch availability, error rates, response times, and resource saturation.
The difference is that AI adds new ways to fail.
An HTTP request may return a successful status while the answer is irrelevant. An agent may complete every technical step but choose the wrong tool. A retrieval system may return documents quickly but give the model weak context. A retry loop may hide errors while increasing latency and cost. A more expensive model may produce longer answers without improving the outcome.
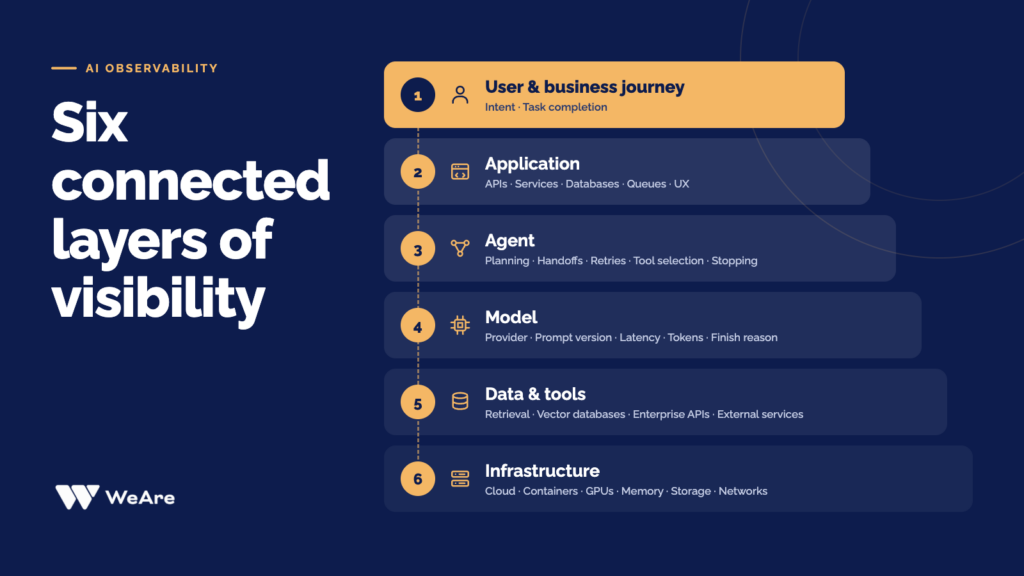
This creates six connected layers of visibility.
The user and business journey, including what the person wanted and whether the task was completed.
The application layer, including APIs, services, databases, queues, and user experience.
The agent layer, including planning, handoffs, retries, tool selection, and stopping conditions.
The model layer, including provider, model, prompt version, latency, tokens, and finish reason.
The data and tool layer, including retrieval, vector databases, enterprise APIs, and external services.
The infrastructure layer, including cloud resources, containers, GPUs, memory, storage, and networks.
Monitoring only one layer leaves gaps. Provider dashboards may show token use, for example, but they do not always explain which customer journey, product feature, agent, or failed workflow caused the consumption.
What to measure in AI applications and agents
There is no single metric that proves an AI system is healthy. A practical scorecard combines performance, reliability, consumption, quality, infrastructure, and outcome measures.
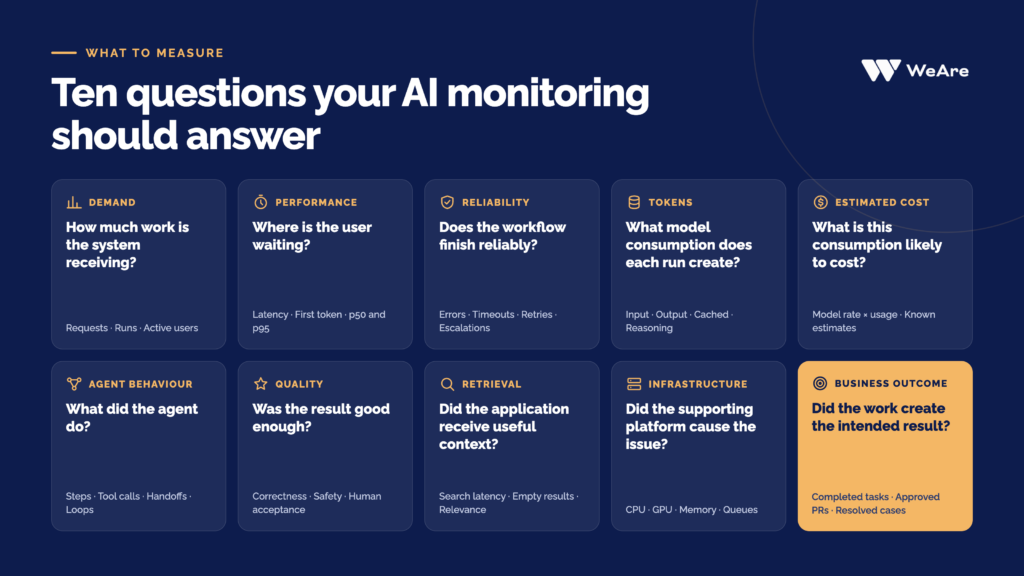
Good AI monitoring should at least be able to answer ten simple questions. It should start with the basics, such as how much work the system receives, where users are waiting, and whether workflows finish reliably.
It is also recommended to look at what makes AI different, including token usage, estimated cost, what the agent actually did, whether the result was good enough, and whether the right context was retrieved.
Infrastructure data helps explain the cause when something goes wrong. But the most important question is the last one: Did the work create the intended result?
When every other measure connects back to real business outcomes, such as completed tasks, approved pull requests, or resolved cases, AI monitoring becomes a tool for better decisions, not just another dashboard.
1. AI cost monitoring and token usage
AI cost monitoring is often the first practical step in AI observability, because large language model (LLM) costs change with traffic, prompt length, response length, model choice, agent steps, retries, and caching.
Most of this is driven by token usage. Tokens are the small units of text a model reads and writes, and providers price input, output, cached, and reasoning tokens differently. Multiplying tokens by their rates gives a useful estimate for comparing runs and spotting sudden changes.
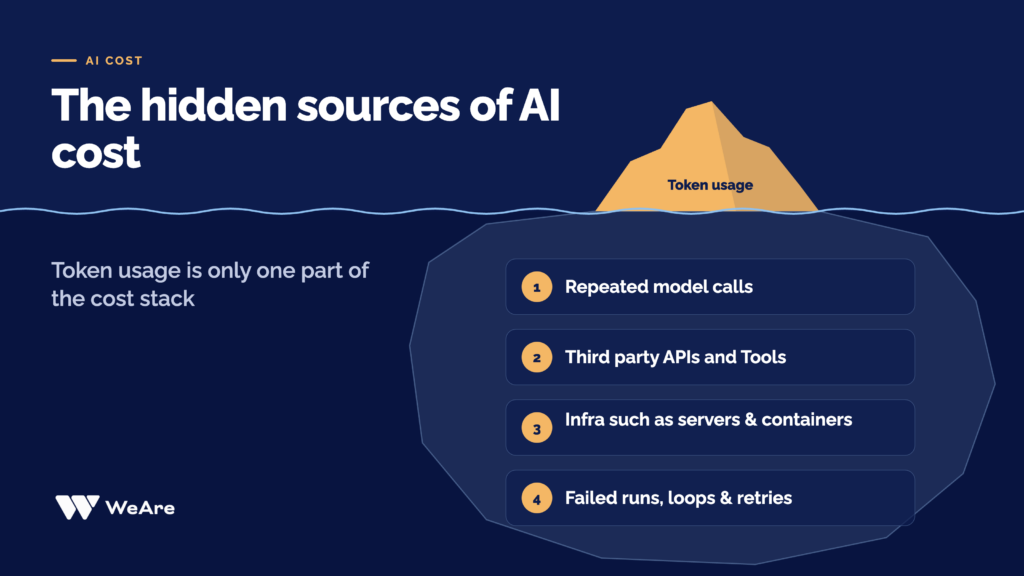
Any token-based cost figure is an estimate, because it is calculated from token counts and published rates rather than from your actual bill. Hidden costs such as repeated model calls, retrieval, third-party tools, GPUs, logging, and failed runs also add to the total.
Splunk helps you see where token usage and estimated cost come from, by application, model, or agent, so teams can spot waste early and compare the estimate with provider and cloud invoices.
2. AI agent monitoring
AI agents do more than answer a question. They plan work, call tools, retrieve data, hand tasks to other agents, and decide when to stop, so one user request can turn into many model and tool calls.
Monitoring only the final answer hides most of that activity. Good AI agent monitoring shows the full path from request to outcome, including which agent and model version ran, each model and tool call with its duration and status, the documents retrieved, token usage, retries, handoffs between agents, human approvals, and the final result.
Distributed tracing is a natural fit for agent observability. A trace follows one request or workflow, and spans capture each step within it. OpenTelemetry gives teams an open standard for collecting traces, metrics, and logs, including emerging conventions for generative AI.
For teams already using Splunk Cloud, structured logs are a quick way to start, giving run-level visibility before moving to full tracing. The key is consistent identifiers, so each agent run connects to its application logs, tool activity, code version, and business outcome.
3. Performance and reliability measures for agents
Latency in AI applications is more than one number. A slow response can come from the model, retrieval system, a tool, a queue, the network, or an overloaded service, so it pays to measure each part separately when user experience matters.
Useful AI performance metrics include time to first token, total response time, model latency, retrieval latency, tool call latency, queue time, throughput, and p50, p95, and p99 latency for your most important user journeys.
Reliability should reflect the whole workflow, not just the API. Track how many runs complete and how many results are accepted, along with tool failures, timeouts, retries, fallbacks, loops, runs that need human attention, and correction rounds.
Breaking failures down by model, prompt version, agent, and release shows exactly where problems start.
Retries deserve special attention, because they can make a request look successful while hiding wasted time and spend. Tracking both the original failure and the recovery path gives a true picture of LLM reliability and cost.
4. Output quality and evaluation
Application monitoring tells you whether an AI system ran. AI evaluation tells you whether the result was actually good. The difference matters, because a response can sound fluent and still be wrong, an agent can call the right tool with the wrong arguments, and a retrieval system can find the right documents while the final answer ignores them.
Quality should be defined for each use case in plain, measurable terms, such as correctness, relevance, groundedness, completeness, correct tool use, policy compliance, prompt injection or data leakage risks, and whether people accept or correct the result.
There is no universal quality score, so a support assistant, a coding agent, and a document classifier each need their own tests.
The most practical approach to LLM evaluation combines automated and human review. Automated evaluators can check large volumes of traffic and reveal patterns, while human reviewers judge ambiguous or high-impact cases.
Start with a representative test set and clear failure categories, run evaluations before release and on production traffic, and compare automated scores with human decisions to keep improving the method.
Keeping evaluation results in the same view as your other telemetry, for example in Splunk, lets you track quality alongside cost and performance and see how each change to a prompt, model, agent, or data source affects the outcome.
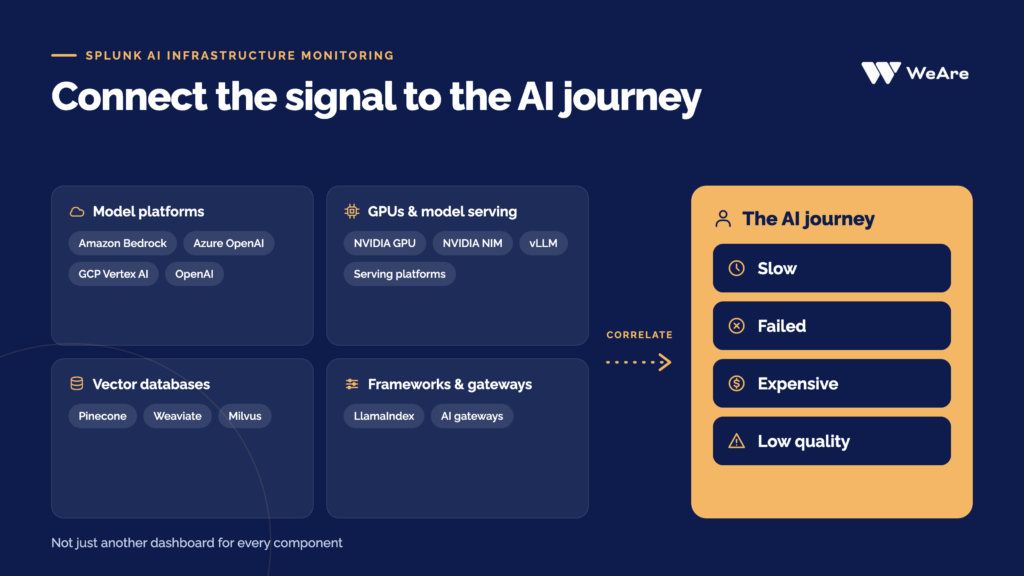
5. Monitoring the AI infrastructure underneath
Some AI applications simply connect to a provider such as OpenAI or Anthropic, while others run on their own servers, GPUs, and databases. For these, AI infrastructure monitoring helps explain why an application is slow or why costs suddenly rise.
Teams typically watch GPU and server utilisation, queue times, and whether any service is reaching its limits.
These numbers are most useful when they are connected to the AI activity they support, so a slow answer can be traced directly back to its cause.
With Splunk, infrastructure data can sit alongside application and agent data, giving teams one clear view from the user’s request to the systems behind it.
How Splunk supports AI monitoring
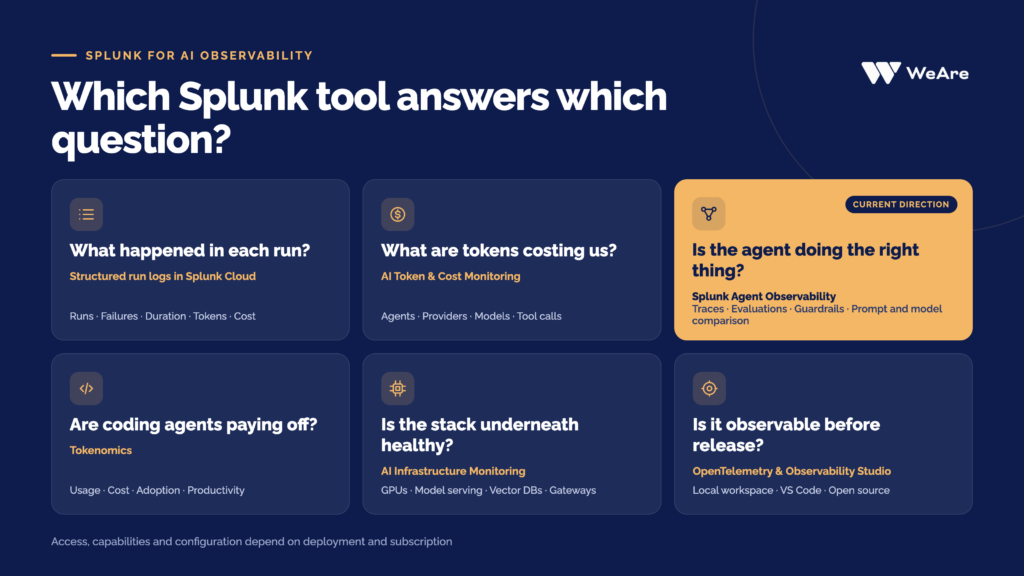
Splunk offers several ways to monitor AI applications, and the right starting point depends on where your team is today.
Many organisations begin with structured AI run logs in Splunk Cloud. If you already use Splunk for logs and alerts, you can send a record of every AI run, including duration, failures, token usage, and estimated cost, and build dashboards and alerts around it. It’s flexible, works well with custom applications, and gives quick, practical visibility.
For deeper insight into spend, Splunk AI Token and Cost Monitoring, new in Splunk Observability Cloud in September 2026, shows token usage and cost across agents, providers, models, and operations, down to individual tool calls. It works with AWS Bedrock, Google Vertex AI, Azure OpenAI and OpenAI, and token rates can be adjusted to match the prices you actually pay. That makes it a strong tool for spotting cost changes early and seeing exactly where spend comes from.
Splunk Agent Observability is Splunk’s main platform for agentic AI, built on its acquisition of Galileo. It traces agent workflows, connects quality, performance, and cost, compares prompts and models, runs evaluations, and supports guardrails while agents are running. It also includes Tokenomics, which shows how teams use AI coding agents, what they cost, and where they add the most value.
Below the application layer, Splunk AI Infrastructure Monitoring covers GPUs, model serving, vector databases, AI gateways, and cloud AI services, and AI Security Monitoring works with Cisco AI Defense to help teams watch for AI-specific security risks.
Everything can be collected with OpenTelemetry, an open standard that helps keep data consistent across services.
Capabilities, evaluator options, data retention, and licensing vary by deployment and subscription, and the AI portfolio is evolving fast.
As a Splunk partner, WeAre helps you choose the right combination, set it up, and start with one AI workload, so you can see value quickly and grow from there. You can get in touch with us through the contact form here.
A practical example from the Renta AI agent workflow
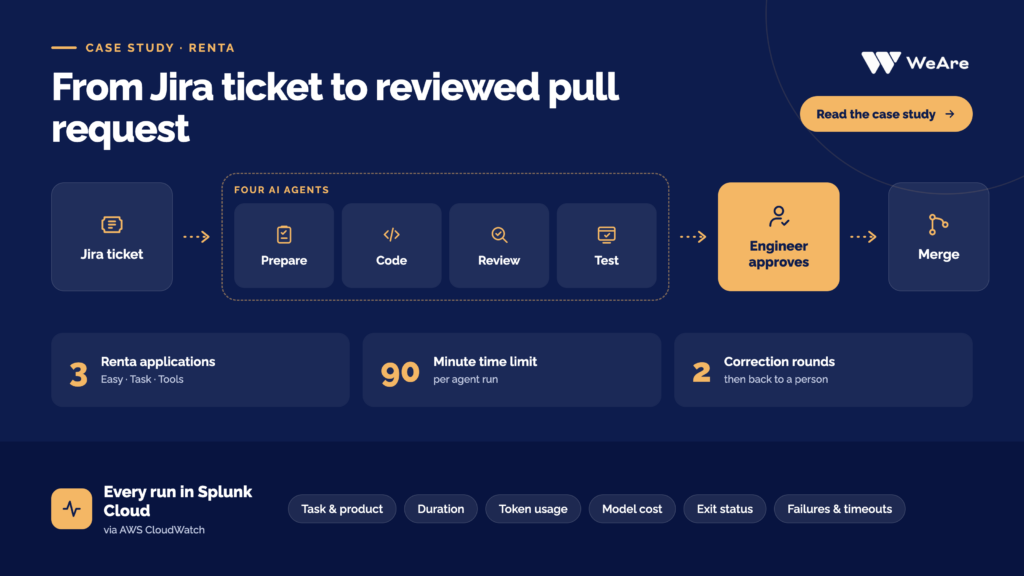
Our work with Renta shows how a focused monitoring setup can support real AI Engineering from day one. Four specialised AI agents turn selected Jira tickets into reviewed pull requests for three Renta applications, preparing the task, writing code, reviewing changes, and testing the result, while engineers approve every change before it is merged.
Renta already used Splunk Cloud for logs and alerts, so WeAre extended it to capture agent activity. Each run creates a structured record with the task, product, duration, token usage, model cost, status, and failures, helping the team spot failed runs, repeated attempts, and cost differences between products.
Time limits, capped retries, and prompt caching help keep waste low, while the Splunk data explains usage patterns that the team can compare with the actual Anthropic invoice.
It is a good example of the value teams can get from Splunk Cloud even before adopting dedicated tools like Splunk Agent Observability.
Read the full Renta AI agents and Splunk monitoring case study.
A step-by-step AI monitoring implementation
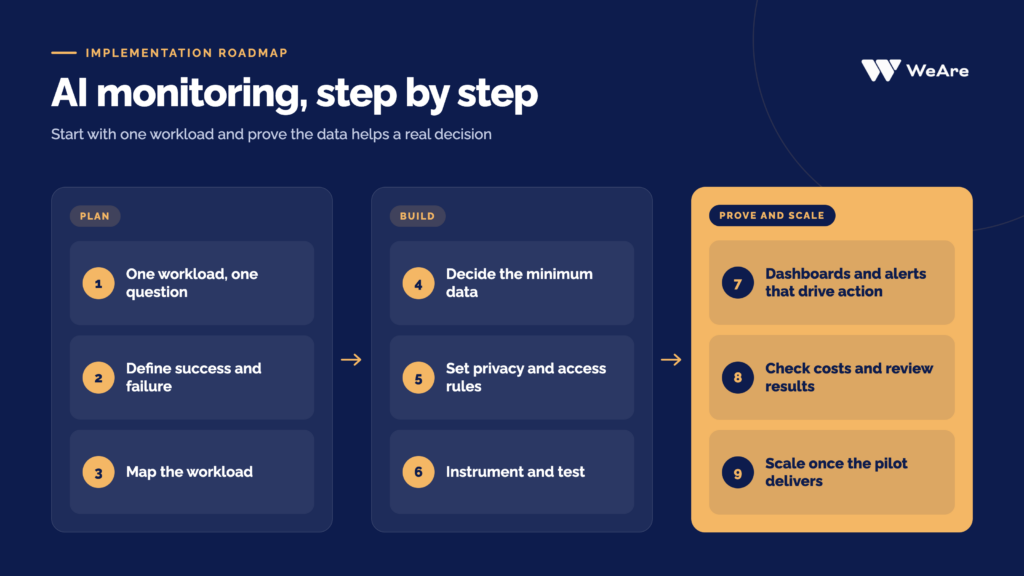
The safest path is to start with one workload and prove that the data helps you make a real decision.
1. Choose one workload and one question. For example, why do some agent runs fail, which workflow drives token costs, or does a new model justify its price? Starting small keeps the work focused and the results clear.
2. Define success and failure. Agree on what a good outcome looks like and which failures you want to see, such as timeouts, tool errors, rejected answers, or human escalations.
3. Map the workload. List the users, services, agents, models, tools, data sources, and owners involved, so you know where the data needs to connect.
4. Decide the minimum data. Pick only what answers your question. Most pilots need a run ID, model, agent, duration, status, errors, token counts, version, and outcome.
5. Set privacy and access rules. Decide whether prompts and responses can be stored, and apply redaction, access control, and retention before real data flows in.
6. Instrument and test. Use structured logs, OpenTelemetry, and the right Splunk capabilities, then test successful, failed, slow, and expensive runs to make sure every number traces back to its source.
7. Build dashboards and alerts that drive action. Each view should show what changed and where to look next, and each alert should have an owner and a clear response.
8. Check costs and review results. Compare usage estimates with invoices, review weak or failed runs with the team, and improve prompts, models, or workflows based on what you learn.
9. Scale once the pilot delivers. Reuse what works for the next workload, and confirm data volume and licensing before you expand.
Common AI monitoring mistakes
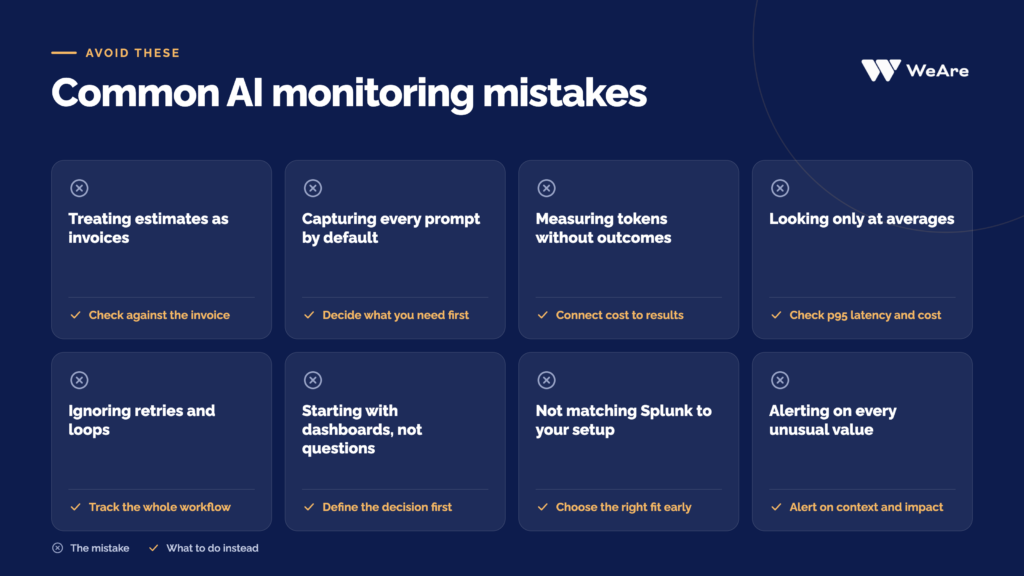
Treating estimates as invoices. Token-based cost figures are great for comparison and alerting, but financial reporting should always be checked against the actual invoice.
Capturing every prompt by default. Full prompts help with troubleshooting, but they can include personal or confidential data and increase data volume. Decide what you need before you collect it.
Measuring tokens without outcomes. The cheapest run is not always the best one if it fails or needs fixing. Always connect cost to results.
Looking only at averages. Averages can hide the slow and expensive runs. Look at p95 latency and cost, then check the individual runs behind them.
Ignoring retries and loops. A run can end successfully after several failed attempts that quietly added cost and delay. Track the whole workflow, not just the final status.
Starting with dashboards instead of questions. Dashboards are most valuable when they answer a clear business question, so define the decision and success criteria first.
Not matching Splunk to your setup. Splunk offers flexible options across SaaS, on-premises, and different subscription tiers. Choosing the right fit for your deployment from the start helps you get the most out of it.
Alerting on every unusual value. Not every token spike is an incident. Good alerts combine context, impact, and a clear action for the owner.
How WeAre can help
Monitoring AI well takes more than a dashboard. It needs the right instrumentation, a well-designed application, and a clear way of working.
WeAre brings all three together, with expertise across AI Engineering, software development, cloud engineering, and Splunk observability. We don’t just advise on AI agents; we build and run them ourselves, as our work with Renta shows.
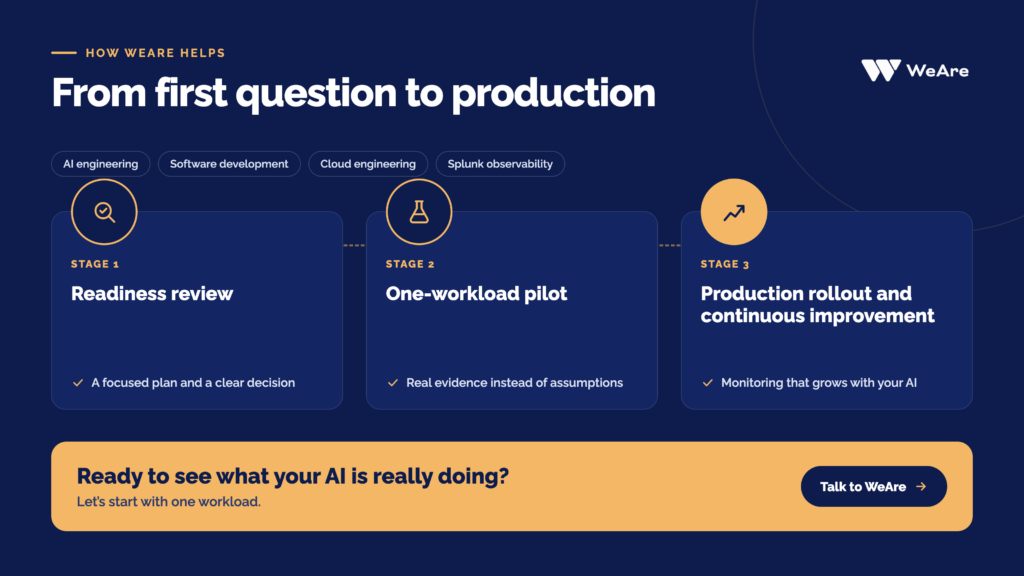
We help you move from first question to production in three clear stages.
1. AI monitoring readiness review. Together we pick one workload and one business question, map your data, review privacy and access, and find the right Splunk setup and licensing for your needs. You get a focused plan and a clear decision on whether a pilot makes sense.
2. One-workload pilot. We instrument the workload, connect it to Splunk, test the key failure and cost scenarios, and build the first dashboards and alerts. Depending on your environment, that can start with structured run logs in Splunk Cloud or go straight to Splunk Observability Cloud capabilities. Within weeks, you have real evidence instead of assumptions.
3. Production rollout and continuous improvement. Once the pilot proves its value, we extend it to more workloads and keep improving data quality, alerts, cost reviews, and model comparisons, so your AI monitoring grows with your AI.
Every engagement starts by agreeing on scope, success measures, and data boundaries, so you know exactly what you’ll get before work begins.
Looking for more? WeAre also offers Splunk observability consulting, software development services, and fully managed observability through Observability Hub.
Ready to see what your AI is really doing? Let’s start with one workload. Get in touch with us here.
FAQs
What is AI monitoring?
AI monitoring collects and connects evidence about an AI application’s performance, reliability, token use, estimated cost, agent behaviour, output quality, infrastructure, and business outcomes.
It helps teams understand what happened when an AI workflow becomes slow, expensive, unreliable, or inaccurate.
What is the difference between AI monitoring and AI observability?
AI monitoring usually tracks known measures and thresholds. AI observability goes further by connecting logs, metrics, traces, evaluations, and business events so engineers can investigate questions they did not define in advance.
In practice, a mature AI monitoring approach is built on observability data, because that broader context helps teams understand not only that something changed, but why it changed and where to investigate.
How do you monitor AI costs?
Capture token categories, model, provider, rate version, requests, retries, tools, evaluation activity, and infrastructure use.
Calculate cost estimates for operational analysis, then reconcile them with provider and cloud invoices.
Where the business result can be measured, report cost per successful outcome, not just total spend.
What is AI token usage?
AI token usage is the amount of content a model processes and produces.
Common categories include input, output, cached, and reasoning tokens. Providers may price these categories differently, so monitoring should preserve those distinctions to support accurate cost analysis and comparison.
Can Splunk monitor AI agents?
Yes. Teams can send structured AI run logs to Splunk Cloud, use Splunk AI Token and Cost Monitoring for token and cost visibility, use AI Infrastructure Monitoring for the underlying components, and use Splunk Agent Observability for agent traces, evaluations, cost, and guardrails where the required access and features are available.
What is the difference between Splunk AI Token and Cost Monitoring and Tokenomics?
AI Token and Cost Monitoring is part of Splunk Observability Cloud and shows token usage and calculated cost for your AI agents and AI infrastructure providers.
Tokenomics is a capability inside Splunk Agent Observability that focuses on coding agent usage, cost, adoption, and productivity by team and user.
Facebook
Twitter
LinkedIn