
Log Management 101: Tools, Best Practices and Splunk
Most applications, servers, cloud platforms, databases and network devices produce or expose event data. These records can explain why a payment failed, who changed a configuration or when a service began to slow down.
The challenge is making the right evidence available, trustworthy and searchable when someone needs it. Scattered files, missing events and inconsistent timestamps make investigations harder. Uncontrolled collection also creates storage costs without necessarily improving visibility.
This guide explains how log management works, how the main tool categories fit together, and where Splunk supports operational analytics within a broader logging and archiving architecture.
What is log management?
Log management is the coordinated practice of collecting, transporting, processing, storing, searching, monitoring, protecting and retaining log data throughout its lifecycle, including its eventual disposal. It supports troubleshooting, security investigations, audits and business analysis.
A log entry is typically a timestamped record of an event in a digital system. It might describe a successful sign-in, a database timeout, an API request or an administrator’s action.
Centralized log management brings records from multiple sources into a shared platform or governed pipeline. Centralization does not require every record to live in one physical location. It requires consistent ways to find, interpret, protect and manage the data.
Consider a failed checkout. An application error alone may say little. Correlating it with a payment-provider timeout, database events and a recent configuration change can reveal the sequence behind the failure.
Which logs should you collect?
Begin with the questions your teams need to answer. Common sources include:
- Application logs: errors, warnings, transactions and application-specific events.
- Infrastructure logs: operating-system activity, processes, authentication and system changes.
- Cloud and platform logs: cloud audit events, Kubernetes activity and managed-service events.
- Network logs: firewall decisions, DNS activity, VPN connections and traffic flows.
- Security and identity logs: sign-ins, access decisions, privilege changes and endpoint detections.
- Database and audit logs: administrative actions, schema changes and selected database activity.
- Web, API and business-event logs: requests, response codes, orders, payments and process outcomes.
For each source, identify an owner, expected volume, sensitivity, investigation value and retention requirement. Avoid assuming that all available data needs continuous indexing or the same storage policy.
Why log management matters
Faster investigations
A common search environment reduces the effort spent locating evidence across servers and team-owned tools. Consistent fields and correlation identifiers help responders reconstruct events across services and distinguish a symptom from its underlying cause.
Better security visibility
Suspicious activity often spans several systems. A sign-in, privilege change and unusual data transfer may look ordinary in isolation. Together, they can justify investigation. Missing sources or inconsistent parsing can leave gaps in that sequence.
Stronger audit evidence
Logs help establish who acted, what changed, and when. Their usefulness depends on controlled access, reliable timestamps, documented data lineage, and evidence that relevant events reached their intended destination. Retention and immutability are parts of that design, rather than proof of compliance by themselves.
Clearer service and business impact
Technical events can expose failed orders, slow authentication and broken integrations. Connecting them to service metrics helps teams prioritize issues by customer impact. Reliable log data also supports automation and AI-assisted investigation, provided its quality and limitations are understood.
Log management, log monitoring, observability and SIEM - what’s the difference?
These capabilities overlap, but their purposes differ.
| Agent | Responsibility |
|---|---|
| Product owner | Reads the selected ticket, adds acceptance criteria and technical context, and checks whether the task suits the agent workflow. |
| Developer | Implements the change on a separate branch, runs checks, and opens a pull request in Bitbucket. |
| Reviewer | Checks the proposed code against the requirements and posts review comments. |
| Tester | Starts the application and tests the changed user flow in a browser. |
Metrics show trends and changes. Traces follow requests across services. Logs provide event-level detail. Correlating these signals helps teams move from a service-level symptom to the relevant evidence.
A security information and event management platform, or SIEM, adds security-focused analytics and workflows. Its effectiveness still depends on the coverage, quality and governance of the underlying data.
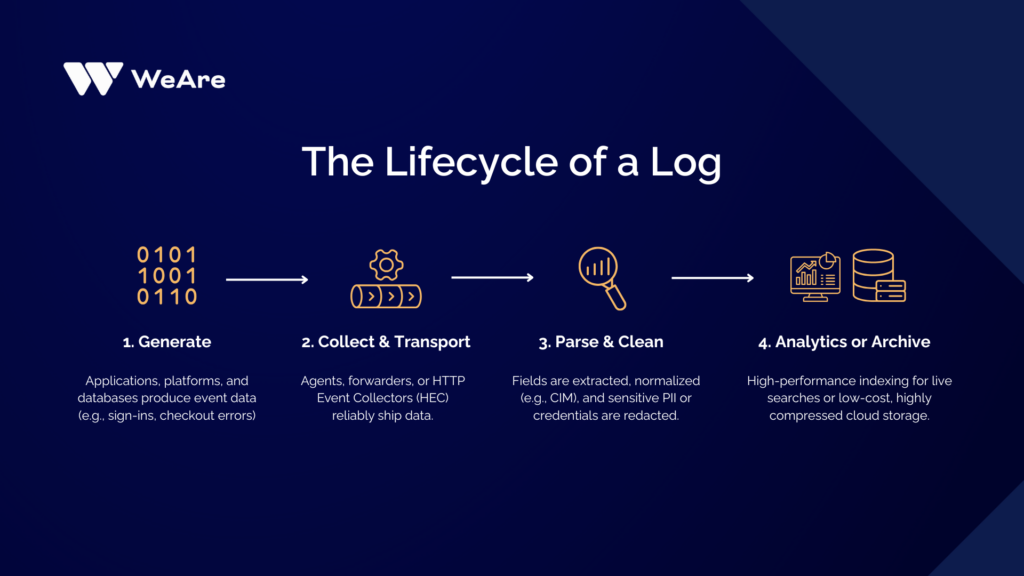
How the log management lifecycle works
1. Define outcomes and ownership
Agree on priority services, investigation scenarios and audit requirements. Assign responsibility for the source, pipeline, platform and response. Define success in practical terms: finding a failed transaction, detecting missing audit events or retrieving an archived record within an agreed timeframe.
2. Generate useful events
Where you control the source, establish a logging standard. Useful fields normally include:
- Timestamp with an explicit timezone.
- Service, application and environment identifiers.
- Event type, severity and outcome.
- An unambiguous message and relevant error details.
- Request, transaction or trace identifiers where available.
Structured formats such as JSON simplify automated interpretation. Stable field names and meaningful values matter more than format alone. A consistently structured event that says only “something failed” still provides little diagnostic value.
3. Collect and transport reliably
Collection options include agents, forwarders, syslog receivers, APIs, cloud integrations, and event streams. Splunk HTTP Event Collector, or HEC, provides an HTTP-based ingestion interface.
Buffering absorbs temporary bursts, while backpressure helps manage downstream congestion. Neither guarantees delivery. Depending on the integration, reliability also requires persistent queues, acknowledgements, retries, duplicate handling and a dead-letter destination for events that cannot be processed.
Document where an acknowledgement occurs: receipt by a collector is not necessarily confirmation that the final destination stored the event. Test outages, restarts and queue exhaustion, including how operators recover rejected data.
4. Parse, enrich and normalize
Extract fields such as service, host, user, severity and outcome. Add context such as application ownership or asset criticality where useful.
Normalization establishes shared meaning across different source formats. In Splunk, the Common Information Model, or CIM, provides common field conventions and data models for compatible searches and content. A source still needs the appropriate mappings; ingestion alone does not make it CIM-compliant.
5. Route and store intentionally
Separate data that needs frequent interactive search from records held primarily for long-term retention. Govern filtering, masking and routing so that cost controls do not remove required evidence.
Define retention and access rules by data category. Include how quickly older records must be retrieved, what restoration costs, and whether the retained format remains usable without the original application.
6. Investigate, alert and complete the lifecycle
Use searches for investigation, dashboards for recurring questions and alerts for conditions requiring action. Each production alert needs an owner, severity, response path and supporting context.
At the end of the applicable retention period, dispose of records according to approved policy, accounting for any valid holds. Include archive copies and exports in that policy; deleting an indexed copy does not necessarily delete the underlying record elsewhere.
What does a centralized logging architecture look like?
A practical architecture separates six responsibilities:
| Layer | Responsibility | Key design question |
|---|---|---|
| Sources | Generate relevant events | Are required actions actually logged? |
| Collection | Receive and transport records | What happens during an interruption? |
| Processing | Parse, redact, enrich and route | Are transformations controlled and observable? |
| Analytics | Support search, correlation and alerting | Which records need fast access? |
| Archive | Preserve records for longer retention | Can records be located, restored and eventually deleted? |
| Operations | Manage access, changes and pipeline health | Who detects gaps and restores service? |
Analytics and archive destinations can receive data through separate routes. Archiving does not always mean waiting for searchable data to expire and then moving it elsewhere.
Document each route, its transformations and its failure behaviour. For audit data, establish how to reconcile source activity with destination records, using suitable counts, identifiers or other completeness checks. A healthy storage account cannot reveal events that never arrived.
Log management best practices
Protect data before it spreads
Avoid logging passwords, access tokens and unnecessary personal information. Apply minimization and redaction early, especially before routing records to several destinations. Restrict access to sensitive sources and audit use of the logging platform itself. The OWASP Logging Cheat Sheet provides practical guidance on event content, sensitive data and verification.
Treat pipeline health as a production concern
Monitor source freshness, ingestion delays, parsing failures, rejected events, queue utilisation and destination availability. Distinguish a quiet source from a broken integration by recording its expected behaviour. Assign an owner and response process to pipeline alerts.
Design retention and immutability together
WORM means “write once, read many.” It can protect records against modification and deletion during an enforced retention period. That protection can also prevent an intended deletion, so reconcile privacy, retention, and legal-hold policies before data enters immutable storage.
Verify the evidence, not just the storage
Trustworthy audit evidence also depends on synchronized clocks, access auditing, controlled configuration changes and verified ingestion completeness. Record transformation rules and preserve the information needed to interpret events later. Test archive retrieval against realistic requests, including older formats and restricted-access records.
Measure cost and usefulness together
Track volume and cost by source alongside search usage, investigation value and retention obligations. Include infrastructure, licensing, archive retrieval, network transfer and operating effort. Review noisy sources with their owners before changing collection rules, and validate that detections and audit requirements remain supported.
Looking for out-of-the-box log management and archive solution?
Yes! Show me Observability Hub →Which log management tools do you need?
“Log management tools” describes several categories rather than one interchangeable product type.
| Tool category | Main role | What to evaluate |
|---|---|---|
| Log analytics tools | Search, correlate, and visualize event data | Query performance, parsing, access controls and investigation usability |
| SIEM platforms | Apply security analytics and investigation workflows | Detection content, normalization, security integrations and analyst workflows |
| Observability platforms | Connect telemetry to application and service health | Relationships between logs, metrics and traces, and troubleshooting context |
| Data pipelines | Collect, transform, buffer and route events | Delivery behaviour, persistent storage, processing controls and failure recovery |
| Archive storage | Retain records outside the primary analytics tier | Retention enforcement, immutability, retrieval time, portability and deletion controls |
These categories overlap. A platform may provide several capabilities, but their availability, limits, and commercial terms need evaluation separately. Archive storage, for example, does not necessarily offer the same interactive search experience as an analytics platform.
Use representative data in a proof of concept. Test your important searches, peak ingestion, a destination outage, and archive recovery. Compare total operating cost and the skills needed to run the proposed architecture, rather than relying on feature lists alone.
How Splunk supports log management
Splunk Enterprise and Splunk Cloud Platform support ingestion, indexing, searching, correlation, dashboards and alerting for machine data. Splunk Search Processing Language, or SPL, allows teams to turn events into investigation results and operational views.
Splunk can work with varied source formats, including field extraction at search time. This flexibility does not eliminate the need to validate event boundaries, timestamps, source types and field quality.
Implementation choices determine the result: source onboarding, index design, permissions, search workloads, retention and capacity all require ownership. Use Splunk Validated Architectures where applicable and check capabilities against the deployed product and version.
Splunk retention versus external archiving
Splunk’s own data lifecycle options and an external archive are distinct architectural choices.
In Splunk Enterprise, data reaching the frozen stage is deleted by default unless archiving is configured. Archived data must be restored to a searchable state for investigation; frozen does not mean immediately searchable. See Splunk’s indexed-data archiving documentation.
Splunk Cloud Platform has archive options whose availability and configuration depend on the service. For example, Splunk documents a managed archive option for expired data. Confirm entitlement, retention and restoration behaviour for the actual environment in the Cloud Platform archive documentation.
An external archive architecture can instead route records to object storage independently of Splunk’s index lifecycle. Its immutability, retention, access and recovery controls must be designed explicitly. Using Splunk for analytics does not automatically provide those controls for external copies.
Case study: Splunk analytics with Azure-based archiving
For a financial-sector customer, WeAre combined Splunk operational analytics with Azure Storage for long-term immutable retention, using a Kafka-based integration layer.
At publication, the project reported:
- Approximately 50 GB/day ingested across 15 integrated source systems.
- An architecture designed to scale toward 1 TB/day. This is a design target; the case does not report throughput testing at that level.
- “10+1 years” of immutable retention: 10 years plus one additional year, or 11 years in total. This was a customer-specific requirement, not a universal retention rule.
- Approximately 80% compression for the archived raw dataset. This result is specific to the data and implementation; it is not a guaranteed saving for other environments.
Splunk served operational search and analytics, while Azure WORM policies supported the customer’s stated compliance requirements for long-term retention. The case illustrates a cost-conscious separation of analytics and archival responsibilities. Read the full log and data management case study.
How to get started
Choose one important service and a small set of representative sources. Define the investigation questions, owners and retention requirements before expanding collection.
Validate that you can follow a transaction, detect a missing source, recover from an ingestion interruption and retrieve an archived record. Document the working configuration and onboarding process so that subsequent sources follow a repeatable pattern.
Review the results with operations, application, security and governance teams. Expand when the pipeline delivers usable evidence and its operating responsibilities are clear.
About WeAre
WeAre Solutions Oy is a Finnish observability-focused consultancy and a leading Splunk Elite Partner in the Nordics. We specialize in observability and monitoring (using Splunk), Atlassian services (Jira), and software development. Founded in 2016 and headquartered in Helsinki, our mission is to turn observability into a competitive advantage for organizations.
At WeAre, we help organizations assess their Splunk environments, identify improvement opportunities, and align performance with real business needs. You can start with an observability assessment to understand your current state, or contact our team for a free consultation.
Frequently asked questions
What is the difference between log management and log analysis?
Log management covers the complete data lifecycle. Log analysis examines the records to investigate incidents, identify patterns or answer operational and business questions.
How long should logs be retained?
There is no universal period. Define retention by data category, using the relevant investigation window, contractual commitments, legal requirements, sensitivity and recovery needs. Searchable retention and archive retention may differ.
Is Splunk a log management tool?
Yes. Splunk Enterprise and Splunk Cloud Platform support collecting, indexing, searching and analysing machine data. Their role within a complete solution depends on the surrounding collection, governance and storage architecture.
Facebook
Twitter
LinkedIn