
Splunk .conf26: What the Latest Updates Mean for Observability, AI and Log Management
Observability used to have a fairly clear job: collect metrics, logs, and traces; monitor applications and infrastructure; detect problems; and help technical teams find the root cause faster. That job still matters, but the environments we are trying to understand have become much more complex.
Modern applications now depend on cloud infrastructure, Kubernetes, APIs, third-party services and, increasingly, artificial intelligence. AI agents can call tools, communicate with other agents and make decisions as part of a workflow. At the same time, organisations need to understand not only whether these systems are working, but also what they cost, how reliably they behave and how they affect customers and business processes.
This broader view of observability was one of the clearest themes around Splunk .conf26. The announcements covered everything from AI-agent monitoring and AI infrastructure to log analytics, OpenTelemetry, business journeys, network visibility and AI-assisted incident investigation.
Taken individually, these developments can look like a long list of product updates. Viewed together, however, they tell a much more interesting story: the scope of what organisations can observe is expanding.
What organisations need to observe has expanded
As the IT industry moves deeper into AI adoption, it was no surprise that AI was one of the major themes at Splunk .conf26. Splunk used the conference to show how its observability capabilities are extending into this new area, both by helping organisations monitor AI-powered systems and by using AI within operational workflows.
This creates a new set of observability requirements. An enterprise AI application may depend on GPUs, model-serving platforms, vector databases, APIs, and several supporting services before a user receives a response. Even when the underlying infrastructure appears healthy, the AI experience can still be slow, costly, or produce an unexpected result.
Several Splunk announcements at .conf26 address this wider AI environment. AI Infrastructure Monitoring adds visibility into the systems supporting AI workloads, while Agent Observability focuses on how agents interact with models, tools, and other agents. This matters because an agent can technically complete a request while still choosing the wrong tool, introducing unnecessary latency, or producing a result that does not meet expectations.
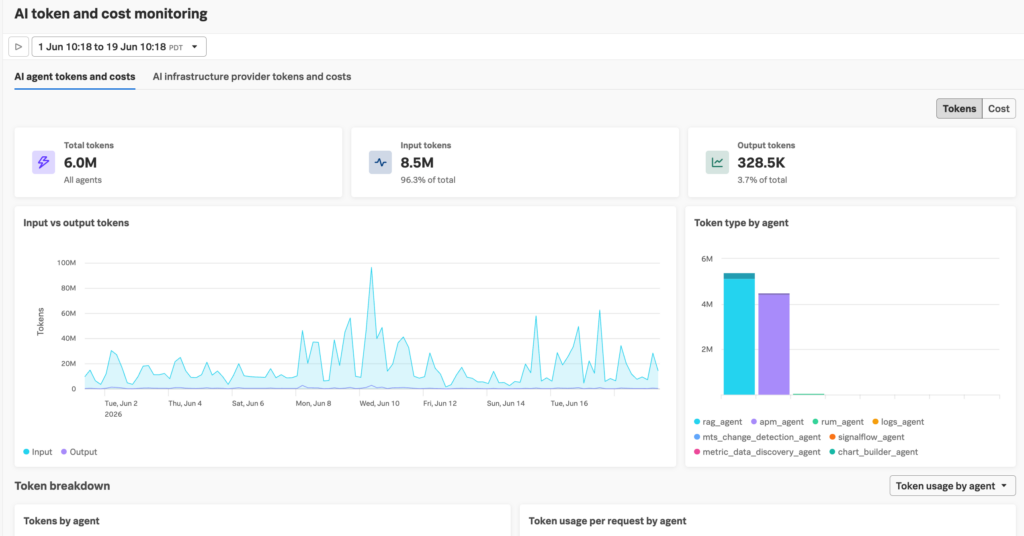
Cost is another part of the same picture. AI Token and Cost Monitoring allows teams to examine token usage and estimated costs across models, providers, and agents. This gives organisations a way to look at AI performance and spending together rather than treating them as completely separate concerns.
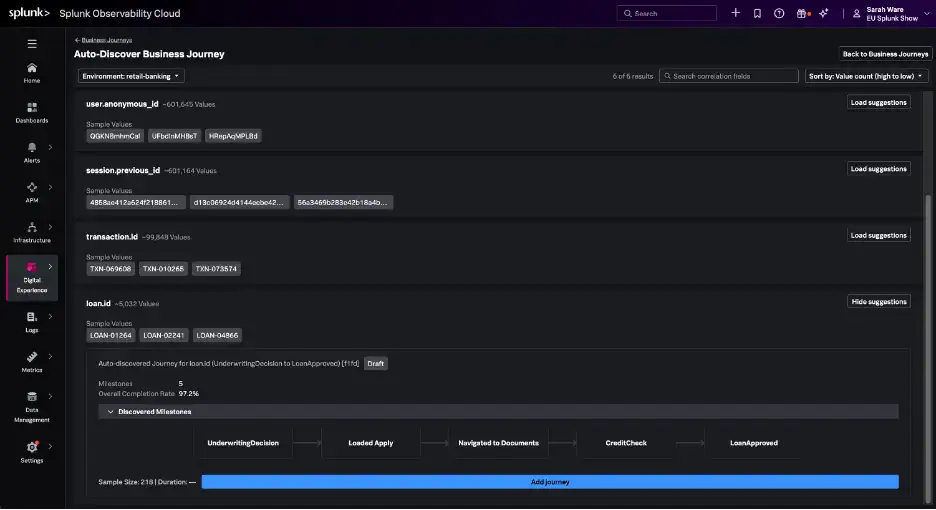
The expansion of observability goes beyond AI. Business Journeys connects technical telemetry with the customer or business process that depends on it. A set of services may individually appear healthy, for example, while users are still unable to complete an onboarding flow, payment, or application process. Looking at the full journey can make the actual impact of a technical issue much clearer.
Splunk is also adding more network context to observability. A slow user experience does not always mean the application itself is at fault; latency, packet loss, DNS, or another network dependency can create similar symptoms. Bringing network and application signals closer together can help teams understand where the problem really sits without moving through several disconnected monitoring tools.
Taken together, these developments show observability moving beyond the health of individual systems. Teams increasingly need to understand how applications, AI components, networks, cost, and business processes affect one another.
How teams build, manage and use observability is changing
The second major change is not about what teams observe, but how observability fits into software development and daily operations.
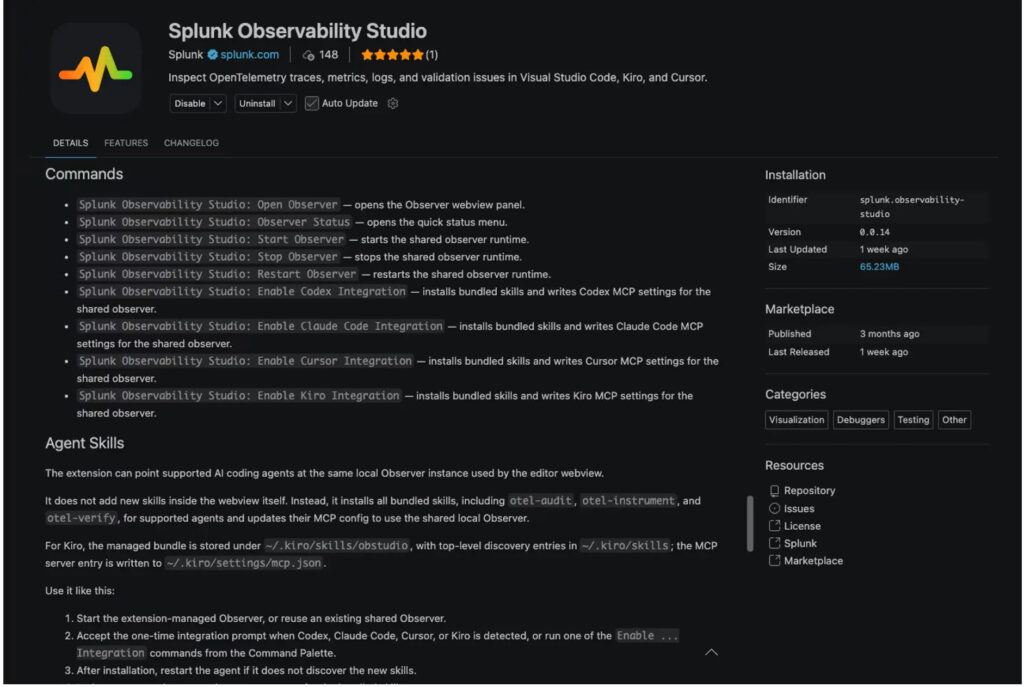
One example is Splunk Observability Studio, which reflects the idea that applications should be observable from the beginning rather than instrumented only after deployment. Developers can inspect OpenTelemetry data while software is still being built, including traces, service dependencies, resource consumption, and AI-agent behaviour. This makes it easier to identify missing or inconsistent telemetry before those gaps become a problem in product
Splunk is also bringing previously separate investigation workflows closer together. SPL search within Logs Explorer gives teams a way to move from guided log exploration into deeper SPL analysis without treating log investigation as a completely separate activity. During a real incident, engineers rarely know in advance whether the answer will be found in a metric, trace, application log, infrastructure event, or network signal, so reducing those boundaries can make investigations more efficient.
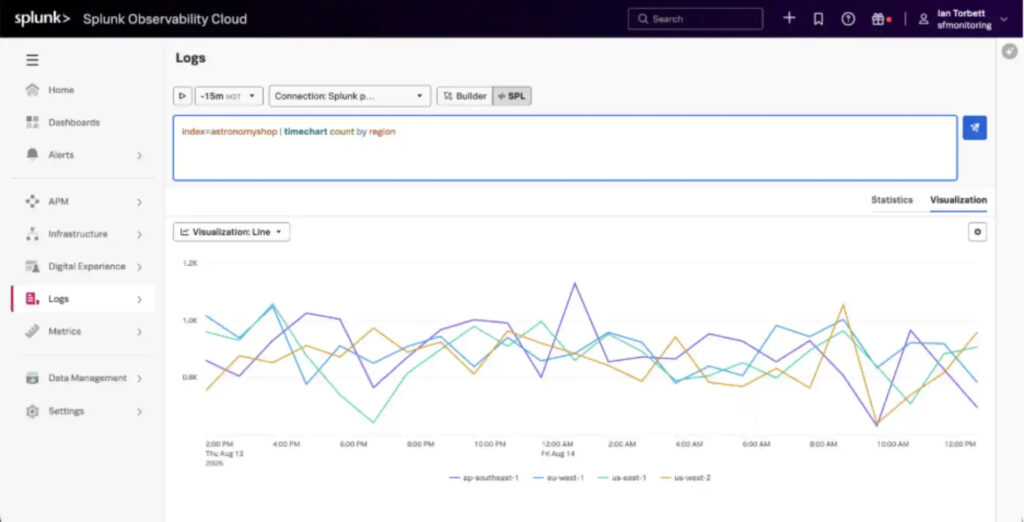
The same applies to log storage and retention. Developments around Observability Logs, Machine Data Lake and federated search give organisations more flexibility in deciding where operational data should live and how it should be accessed. Recent logs may need to be searchable immediately, while older data may only be required for investigations or compliance.
For environments generating hundreds of gigabytes or terabytes of data, this becomes an architecture decision rather than simply a storage setting. The important questions are how quickly the data needs to be available, how long it must be retained, whether it needs to be immutable, and what that retention model will cost over time.
This is also something we see in our work at WeAre. Large-scale log management is not about keeping every piece of data in the same place indefinitely. A useful architecture should balance search performance, retention requirements, and long-term cost according to how the data is actually used. Read our case study here to discover how WeAre helped a financial services company implement log management and archiving to stay compliant with regulations and enable future data analytics.
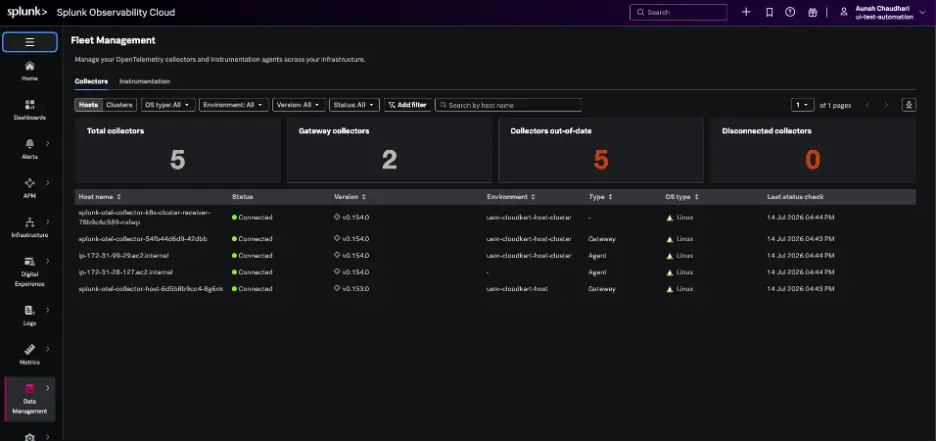
OpenTelemetry Fleet Management addresses another operational challenge. OpenTelemetry gives organisations an open way to collect metrics, logs and traces, but larger environments may have hundreds or thousands of Collectors to configure, update and govern. As adoption grows, maintaining consistency across those Collectors becomes part of the observability architecture itself.
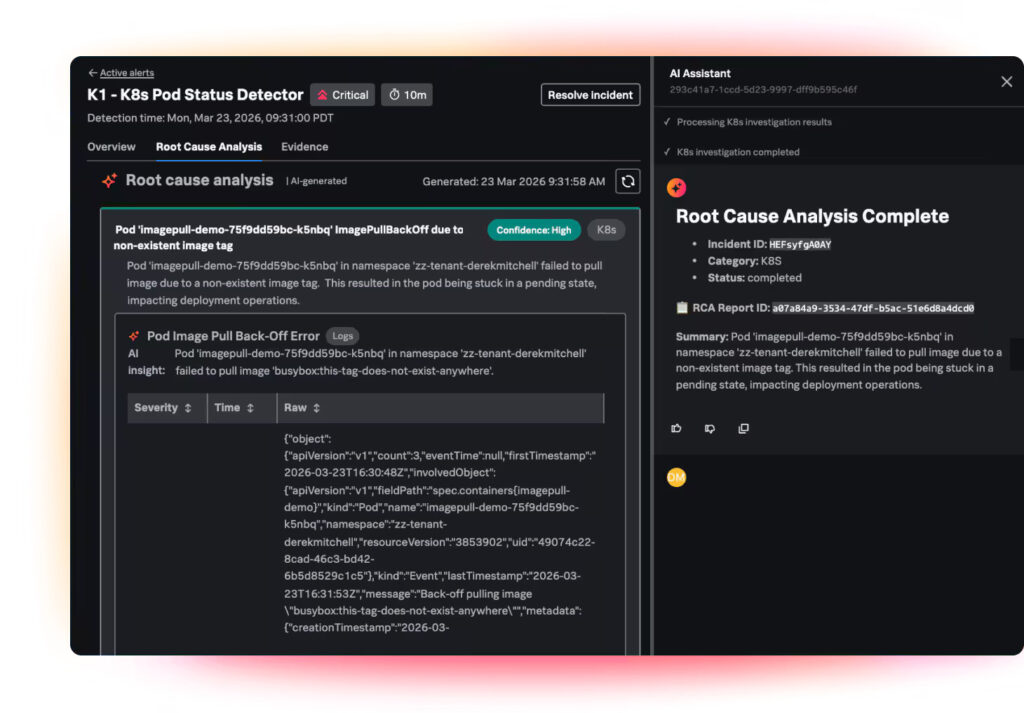
AI is also entering the incident-response workflow. Splunk AI SRE is designed to analyse telemetry and help teams identify likely root causes more quickly. Splunk also demonstrated workflows in which diagnostic context can be passed to a coding agent that proposes a potential fix, with an engineer remaining responsible for reviewing the change.
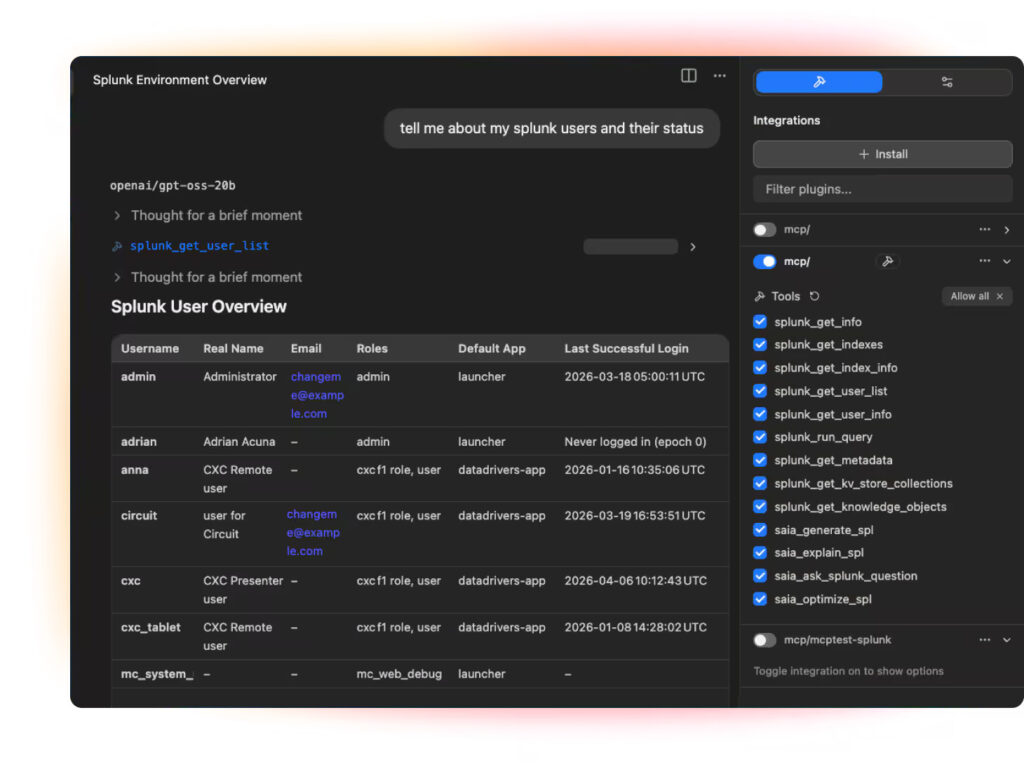
Finally, Splunk MCP Server addresses how AI applications and agents can interact with operational data without bypassing existing controls. Permissions, roles, allowed actions, and audit trails remain important, particularly as AI becomes more involved in operational workflows.
Across all of these developments, the direction is similar: observability is becoming more integrated with development, data management, and incident response rather than remaining a separate monitoring activity.
What does this mean for organisations using Splunk?
The number of announcements at .conf26 makes it tempting to look at the feature list and ask which capabilities should be enabled first. In practice, the better starting point is the operational problem the organisation is trying to solve.
For companies moving AI applications or agents into production, that may mean improving visibility into AI infrastructure, behaviour and cost. We recently published a case study where we built an AI agent for our customer Renta, and we have outlined how we are using Splunk to monitor AI agents, including costs and their performance. Read the full case study here.
For organisations dealing with rapidly growing log volumes, data lifecycle and storage architecture may be more urgent. Teams already using OpenTelemetry at scale may need better governance and Collector management, while others may benefit most from connecting technical telemetry with customer and business journeys.
There is no reason to adopt every new capability at once. The value comes from identifying where the current observability environment lacks visibility, context, or efficiency and then applying the technologies that address those gaps.
That also reflects a broader change in observability. Metrics, logs, and traces remain the foundation, but the useful context around them is expanding. A trace becomes more valuable when it shows which business process failed. AI usage data becomes more useful when it can be tied to cost. A network signal becomes more useful when it explains why an otherwise healthy application feels slow to users.
The goal is therefore not simply to collect more information, but to connect the right information so teams can understand what is happening and why it matters.
Conclusion
Splunk .conf26 shows observability changing in two important ways. The scope is broader, extending beyond applications and infrastructure into AI systems, networks, cost, and business processes. At the same time, observability is becoming more integrated with software development, data management and incident response.
For organisations, the practical takeaway is not to implement every new capability. Instead, look at where the existing observability environment has gaps and decide which developments can address them without adding unnecessary complexity.
At WeAre Solutions, we help organisations design, implement, and improve Splunk and observability environments across applications, infrastructure, and log data. Our focus is on turning technical visibility into practical operational value while keeping performance, governance, and cost in view.
FAQs
What were the main observability announcements at Splunk .conf26?
The main themes included Agent Observability, AI Infrastructure Monitoring, AI Token and Cost Monitoring, Business Journeys, Observability Studio, AI SRE, OpenTelemetry Fleet Management, log analytics, and expanded network visibility.
What is Splunk Agent Observability?
Splunk Agent Observability provides visibility into generative AI and agentic applications. It helps teams understand how agents interact with models, tools, and other agents, including their performance, behaviour, and cost.
Why does AI cost matter for observability?
Generative AI services can have variable operating costs based on factors such as token consumption. Monitoring those costs alongside performance can help organisations understand whether an AI service is operating efficiently as well as reliably.
What is Splunk Observability Studio?
Observability Studio allows developers to inspect OpenTelemetry telemetry while applications are being developed. The aim is to identify instrumentation gaps earlier and make observability part of the software-development process.
Why is OpenTelemetry Fleet Management important?
As OpenTelemetry is deployed across more applications and environments, organisations also need to manage Collector configurations, upgrades and governance consistently.
Do organisations need to adopt every new .conf26 capability?
No. The most useful capabilities depend on the organisation’s existing challenges, such as AI adoption, growing log volumes, OpenTelemetry management, or limited visibility into business impact.
Facebook
Twitter
LinkedIn